

Value investing is about understanding what a business is truly worth and comparing it with its market price. You are not trying to predict short-term price moves. You are trying to judge whether a stock offers long-term value. This is where stock graphs become essential. They help you see how price, earnings, and valuation move together over time.
- What Is A Stock Graph
- Features of Stock Graphs
- 1. Long-Term Timeframes That Reveal True Trends
- 2. Earnings Per Share Growth as the Foundation
- 3. Price and Earnings Alignment Over Time
- 4. Historical Valuation Levels and Fair Value Ranges
- 5. Identifying Business Cyclicality
- 6. Dividend History and Income Stability
- 7. Viewing Multiple Metrics Together
- Using Stock Graphs to Support Patient Decisions
- Conclusion
When you know which stock graph features matter, you can analyse businesses more clearly and make calm, informed decisions. Let’s understand the stock graphs and look at the features.
What Is A Stock Graph
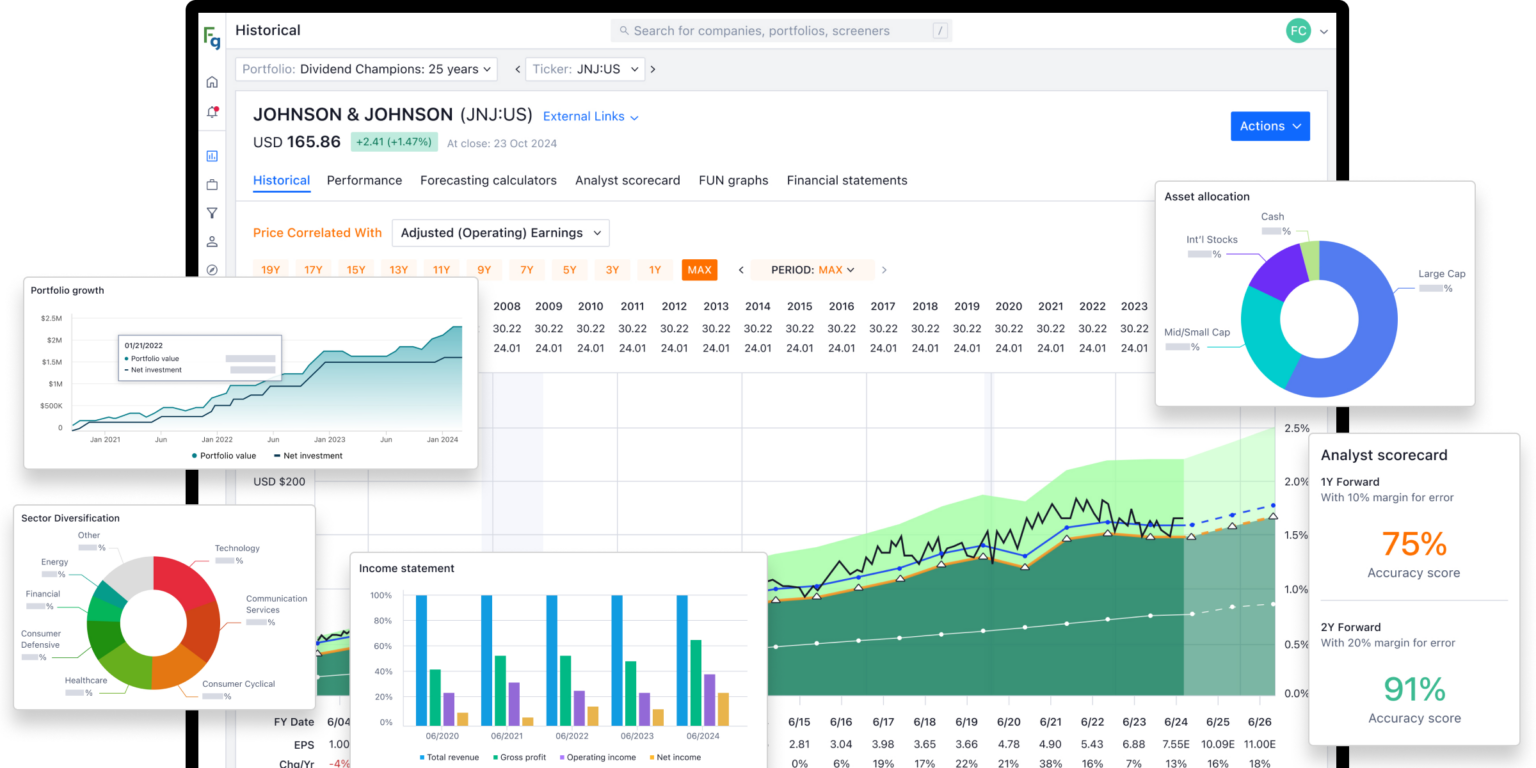
A stock graph is a visual chart that shows how a company’s share price and financial data change over time. It helps you see patterns, trends and relationships that are difficult to understand from numbers alone. By looking at stock graphs, you can quickly understand how a business has performed in the past and how the market has valued it over different periods.
For a value investor, a stock graph makes it easier to judge whether a stock is priced fairly compared to the company’s actual performance.
Features of Stock Graphs
These are the features of stock graphs that every investor should know:
1. Long-Term Timeframes That Reveal True Trends
As a value investor, you should always begin with long-term stock graphs. Charts that cover 10, 15 or even 20 years help you see how a business has performed across different conditions.
- Short-term stock charts often show sharp price movements that can be misleading and create unnecessary noise.
- Long-term views allow you to focus on how the business is performing rather than on daily price changes.
This helps you avoid rushing decisions and maintain a long-term view.
2. Earnings Per Share Growth as the Foundation
One of the most important features you should examine on stock graphs is earnings per share growth. Over time, share prices tend to follow earnings.


- If earnings grow steadily, the price usually follows
- If earnings decline, price struggles
By looking at earnings charts, you can easily see if a company is really growing or just doing well for a short time. This helps you stay away from companies that look good at first but lack strong businesses underneath.
3. Price and Earnings Alignment Over Time
A key stock graph feature for value investors is the comparison between market price and earnings.
- When price closely tracks earnings, it suggests rational market behaviour
- When the price moves far above earnings, valuation risk increases
Look for periods when the stock price does not match how the business is performing. When there is a big gap, the stock may be priced too high or too low. Understanding this helps you make better decisions instead of reacting impulsively.
4. Historical Valuation Levels and Fair Value Ranges
Stock graphs that show historical valuation ranges help you understand how the market has typically priced a business. These ranges act as reference points rather than forecasts.
- If a stock trades consistently above its historical valuation, caution is required
- If it trades below long-term averages, it may indicate a potential value opportunity
This feature helps you assess price fairness using history rather than speculation.
5. Identifying Business Cyclicality
Some businesses grow steadily, while others move in cycles. Stock graphs make this distinction visible. You can see periods of strong growth followed by declines and recoveries.
Understanding cyclicality helps you avoid mistaking temporary earnings peaks as permanent growth. It also helps you adjust expectations and position sizing when analysing cyclical businesses.
6. Dividend History and Income Stability
If income matters to you, dividend trends are an important stock graph feature. Visual dividend tracking shows whether payouts have grown, remained stable or been reduced.
A steady or growing dividend often indicates strong cash flows and disciplined management. Sudden cuts may indicate financial stress. This helps you understand how steady the income is, rather than looking only at the returns.
7. Viewing Multiple Metrics Together
One of the most valuable aspects of advanced stock graphs is the ability to view price, earnings, valuation and dividends together. When these elements can be seen in a single view, you get a clearer understanding of how the market prices business performance.
Looking at everything together saves time and helps you avoid missing important details. It also helps you see whether the current price makes sense when compared to the business’s long-term performance.
Using Stock Graphs to Support Patient Decisions
When you focus on these essential stock graph features, you shift from guessing to evaluating. You learn to ask better questions:
- Is the business growing steadily
- Is the price reasonable compared to history
- Is the income sustainable
This approach helps you stay patient and steady. Over time, it builds trust in your own investing decisions rather than relying on short-term market signals.
Conclusion
Stock graphs are not just visual tools. For value investors, these charts help in decision-making. By looking at earnings, past prices, dividends and long-term performance, you understand the business better.
Studying stock charts with a focus on fundamentals helps you make calm, long-term investment decisions instead of impulsive ones.