
As modern applications scale, so does the complexity of monitoring them. What once seemed manageable quickly turns into a massive challenge especially when high-cardinality metrics enter the picture. If you’re using Prometheus or similar tools, you’ve likely experienced performance slowdowns, rising storage costs, and increasingly difficult queries.
- What Are High Cardinality Metrics?
- Why Prometheus Struggles with High Cardinality
- 1. Memory Consumption Explodes
- 2. Query Performance Degrades
- 3. Storage Inefficiency
- 4. Limited Scalability
- The Hidden Cost of High Cardinality
- How a Modern Time Series Database Solves the Problem
- 1. Optimized for High Cardinality
- 2. Efficient Resource Usage
- 3. Fast Query Performance at Scale
- 4. Horizontal Scalability
- Why Victoria Metrics Is Built for This Challenge
- Real-World Example: Scaling Without Limits
- Best Practices for Managing High Cardinality
- The Future of Observability
- Final Thoughts
High cardinality is one of the most common and frustrating problems in observability today. But the real issue isn’t just the data itself; it’s how your system handles it. The solution lies in adopting a more scalable and efficient time series database designed specifically for modern workloads.
What Are High Cardinality Metrics?
Before diving into the problem, let’s clarify what high cardinality means.
Cardinality refers to the number of unique combinations of labels in your metrics. For example, if you’re tracking requests by user ID, endpoint, region, and device type, the number of unique metric series can grow exponentially.
In real-world systems, high cardinality often comes from:
- User IDs or session IDs
- Dynamic container or pod names
- Microservices with multiple labels
- Custom application-level metrics
While these metrics provide valuable insights, they also create massive data volumes that traditional systems struggle to handle.
Why Prometheus Struggles with High Cardinality
Prometheus is widely used and highly effective for many use cases. However, it wasn’t originally designed to handle extreme levels of cardinality at scale. As your infrastructure grows, several limitations begin to surface.
1. Memory Consumption Explodes
Prometheus stores time series data in memory, which becomes a major bottleneck when cardinality increases. Each new label combination creates a new time series, quickly consuming available resources.


This often leads to:
- Frequent crashes or restarts
- Increased hardware requirements
- Reduced system reliability
2. Query Performance Degrades
As the number of time series grows, queries become slower and more complex. Engineers spend more time waiting for dashboards to load than actually analyzing data.
Slow queries can severely impact incident response, making it harder to detect and resolve issues in real time.
3. Storage Inefficiency
High-cardinality data results in inefficient storage usage. Prometheus can struggle to compress and manage large datasets effectively, leading to increased infrastructure costs.
Organizations often find themselves scaling storage aggressively just to keep up—without seeing meaningful performance improvements.
4. Limited Scalability
Prometheus is not inherently built for horizontal scalability. While workarounds exist, they often add complexity and operational overhead.
At a certain point, teams realize they need a more scalable backend to handle growing data demands.
The Hidden Cost of High Cardinality
High cardinality doesn’t just impact performance—it affects your entire observability strategy.
Without the right system in place, you may experience:
- Blind spots in monitoring
- Delayed alerts and insights
- Increased operational complexity
- Higher infrastructure costs
Worse, teams may start avoiding useful metrics altogether just to keep systems stable, sacrificing visibility in the process.
How a Modern Time Series Database Solves the Problem
The key to handling high-cardinality metrics isn’t reducing data—it’s using the right system to manage it efficiently. A modern time series db is purpose-built to handle massive datasets while maintaining performance and cost efficiency.
1. Optimized for High Cardinality
Unlike traditional systems, modern time series databases are designed to efficiently store and process millions (or billions) of unique time series.
They use advanced indexing, compression, and storage techniques to ensure that high-cardinality data doesn’t become a bottleneck.
2. Efficient Resource Usage
Instead of relying heavily on memory, modern solutions optimize both memory and disk usage. This allows organizations to handle large datasets without constantly scaling infrastructure.
The result is a more stable and cost-effective monitoring system.
3. Fast Query Performance at Scale
A well-designed time series database ensures that queries remain fast—even as data grows. Engineers can explore metrics in real time, enabling faster debugging and better decision-making.
This is critical for reducing downtime and improving overall system reliability.
4. Horizontal Scalability
Modern time series databases are built to scale horizontally, meaning they can handle increasing workloads by distributing data across multiple nodes.
This eliminates the limitations of single-node systems and provides long-term scalability.
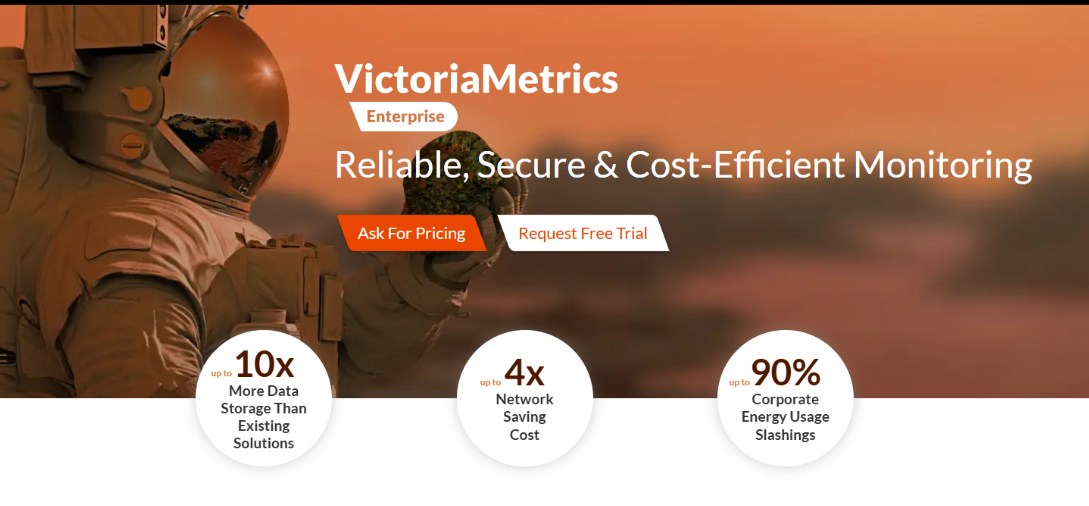
Why Victoria Metrics Is Built for This Challenge
When dealing with high-cardinality metrics, choosing the right backend is essential. Victoria Metrics is specifically designed to address the limitations of traditional monitoring systems like Prometheus.
It offers a powerful and scalable time series database that can handle massive data volumes without sacrificing performance.
Key Advantages of Victoria Metrics
- Handles high cardinality with ease
Efficient storage and indexing ensure smooth performance even with millions of time series. - Lower infrastructure costs
Advanced compression reduces storage requirements significantly. - Fast queries at any scale
Real-time data access enables faster troubleshooting and insights. - Seamless integration with Prometheus
You can keep your existing setup while upgrading your backend for better performance.
With Victoria Metrics, teams no longer need to compromise between visibility and performance.
Real-World Example: Scaling Without Limits
Imagine a fast-growing SaaS platform with thousands of users and microservices. Each service generates metrics with multiple labels, leading to high cardinality.
With a traditional setup, the team experiences:
- Slow dashboards
- Frequent system crashes
- Increasing storage costs
After switching to a modern time series db, they achieve:
- Stable performance at scale
- Faster query responses
- Reduced infrastructure costs
- Improved observability across services
This shift allows the team to focus on innovation instead of firefighting.
Best Practices for Managing High Cardinality
While a modern database solves many issues, it’s still important to follow best practices:
- Avoid unnecessary labels (e.g., raw user IDs when not needed)
- Use aggregation where possible
- Monitor cardinality levels regularly
- Choose tools designed for scalability
Combining good practices with the right technology ensures long-term success.
The Future of Observability
High-cardinality metrics are not going away—in fact, they’re becoming more common as systems grow more complex. The ability to handle this data efficiently is no longer optional; it’s a necessity.
Traditional monitoring tools struggle under this pressure, but modern time series databases provide a clear path forward.
Final Thoughts
If you’re struggling with high-cardinality metrics, the problem isn’t your data—it’s your system. Prometheus and similar tools have their strengths, but they weren’t built for extreme scale.
By adopting a scalable solution like Victoria Metrics, you can transform your monitoring strategy, reduce costs, and gain deeper insights into your systems.
Instead of fighting your data, you can finally make it work for you.